Emotional Bookmarks: Data Physicalization and the Language of Literature
Color has long had a deep connection to our emotions, which cuts through different cultures, time periods, and contexts, from textiles and architecture to design and art. Goethe was the first Western color theorist to suggest that colors have a direct effect on our physical and psychological wellbeing. Writing in his book, Theory of Colours, he argues, “yellow excites a warm and agreeable impression” and “blue tends to melancholy and sadness.” These ideas still resonate, some 200 years later, as notions around the healing properties of green crystals or the power of purple to reduce anxiety persist. The connection between colors and emotions has been explored by many data artists and designers, and there are even algorithms that will automatically select “appropriate” colors for data visualizations, such as pink for data about love. These kinds of algorithms are often based on stereotypes or cultural repetition of color in relation to a given topic. There is no inherent reason why pink should suggest love. It is only through the repeated use of pink in Valentine’s Day cards and romance novel covers that, especially in an American context, the color pink tends to be associated with love. In this project, I was interested in exploring this connection between color and emotion, especially as it is expressed through language. Although words and language are not the only, and not even necessarily the primary way, we might express emotions, it is the way emotion comes through in literature and writing. However, language in literature is never straightforward, and emotional moments are infused with varied meanings and contradictory implications. It was in this complicated mix of interpretation, language, and emotion, that I explored Maggie Nelson’s book Bluets, to pull forth an emotional analysis of the book and create a data physicalization in the form of a woven bookmark.
The project was part of a special issue of dh+lib review called “Making Research Tactile: Critical Making and Data Physicalization in Digital Humanities,” where authors were invited to design a creative, accessible activity that could be adapted in a library or classroom.
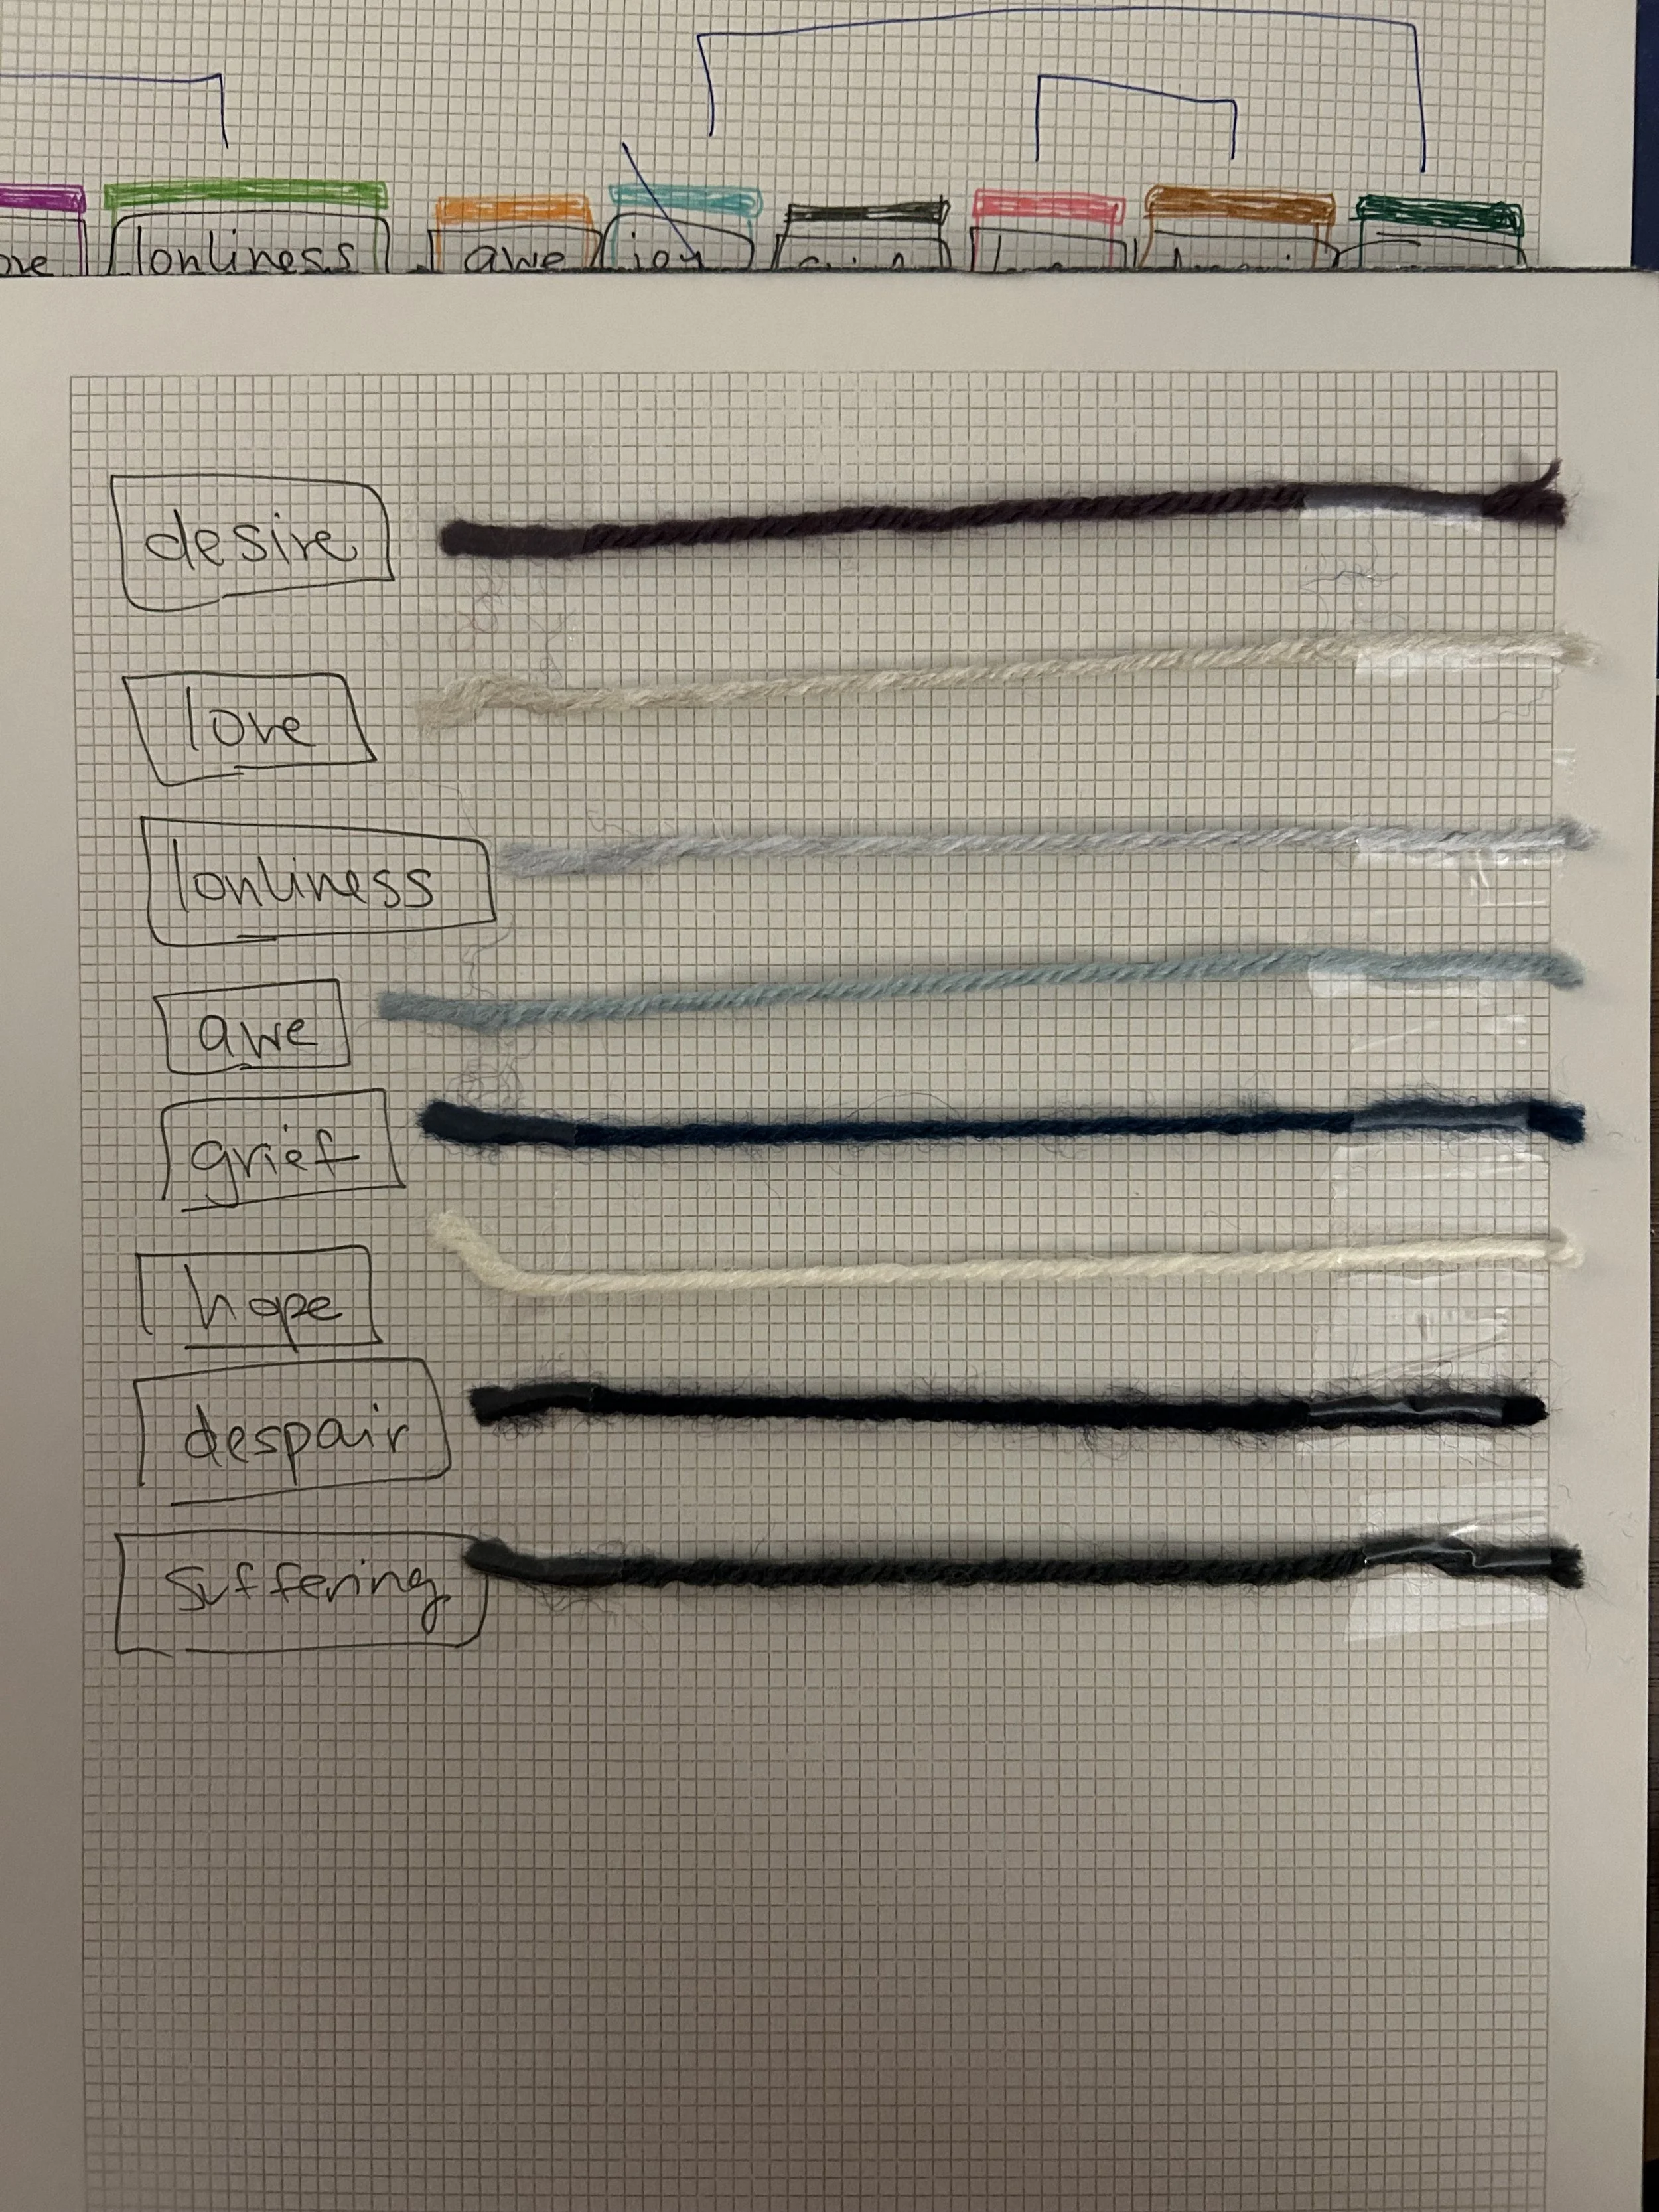
Color-coding emotions for weaving.
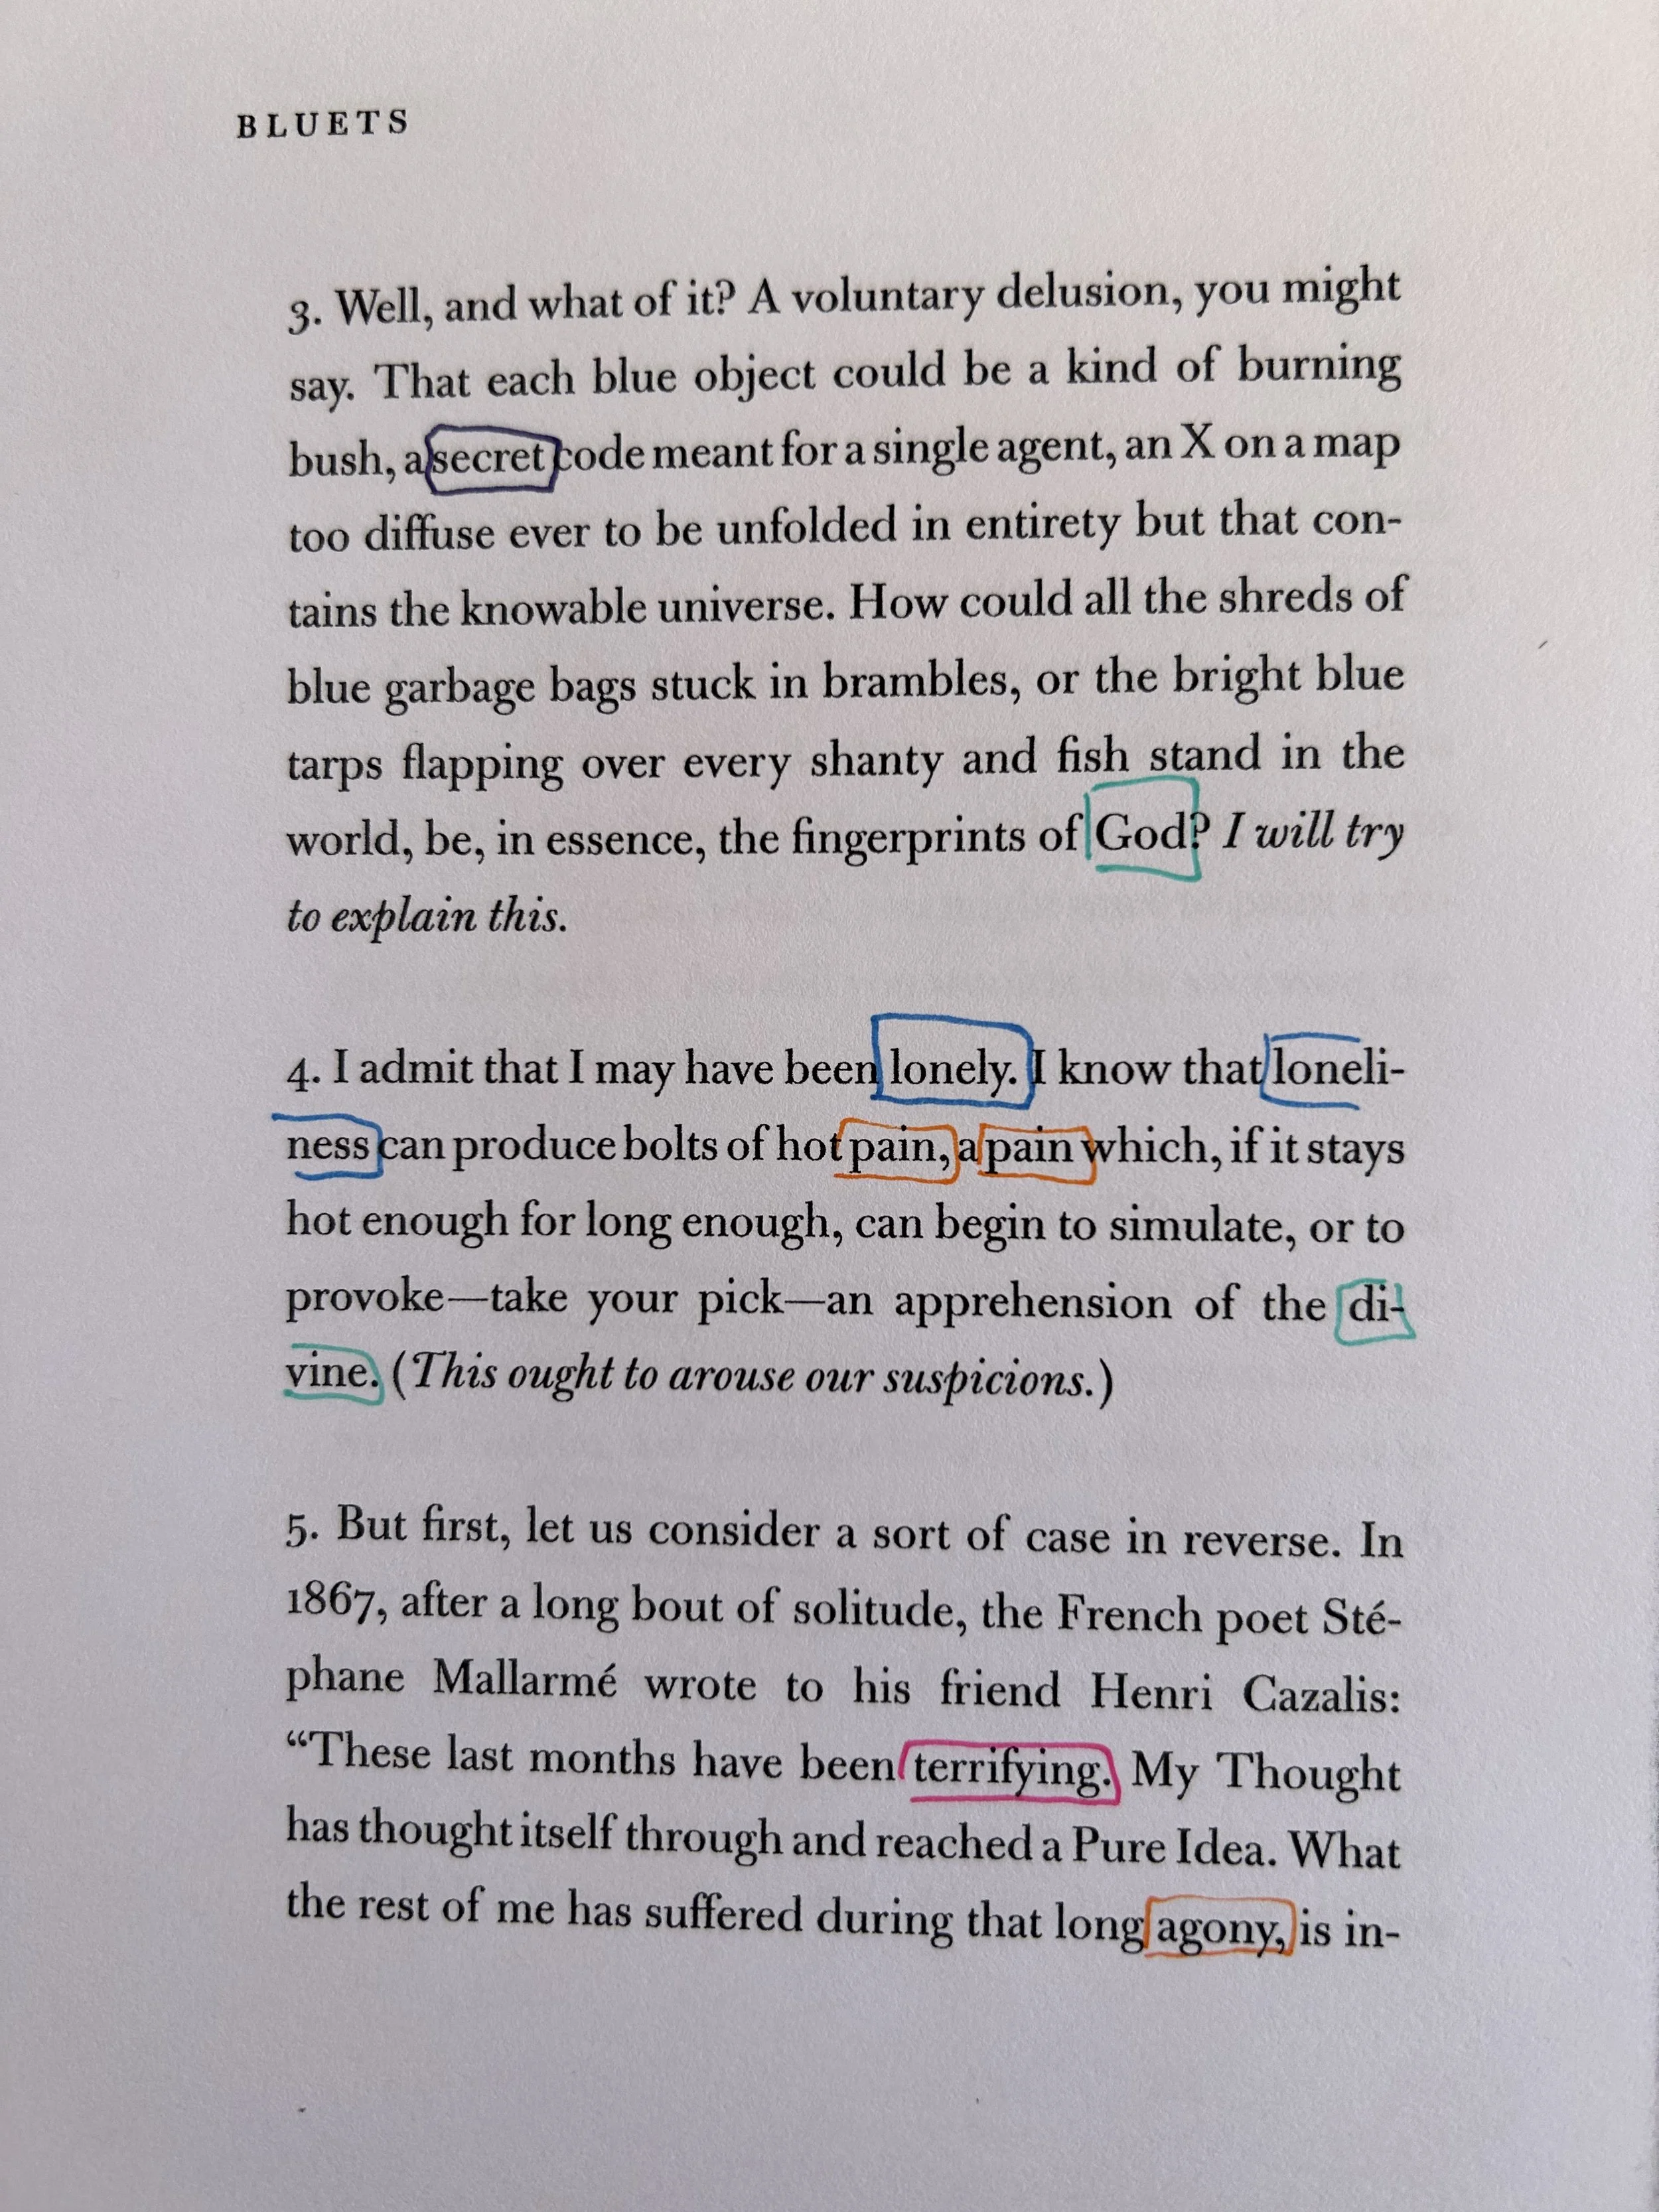
Collecting data by hand, for comparison to a digital sentiment analysis.
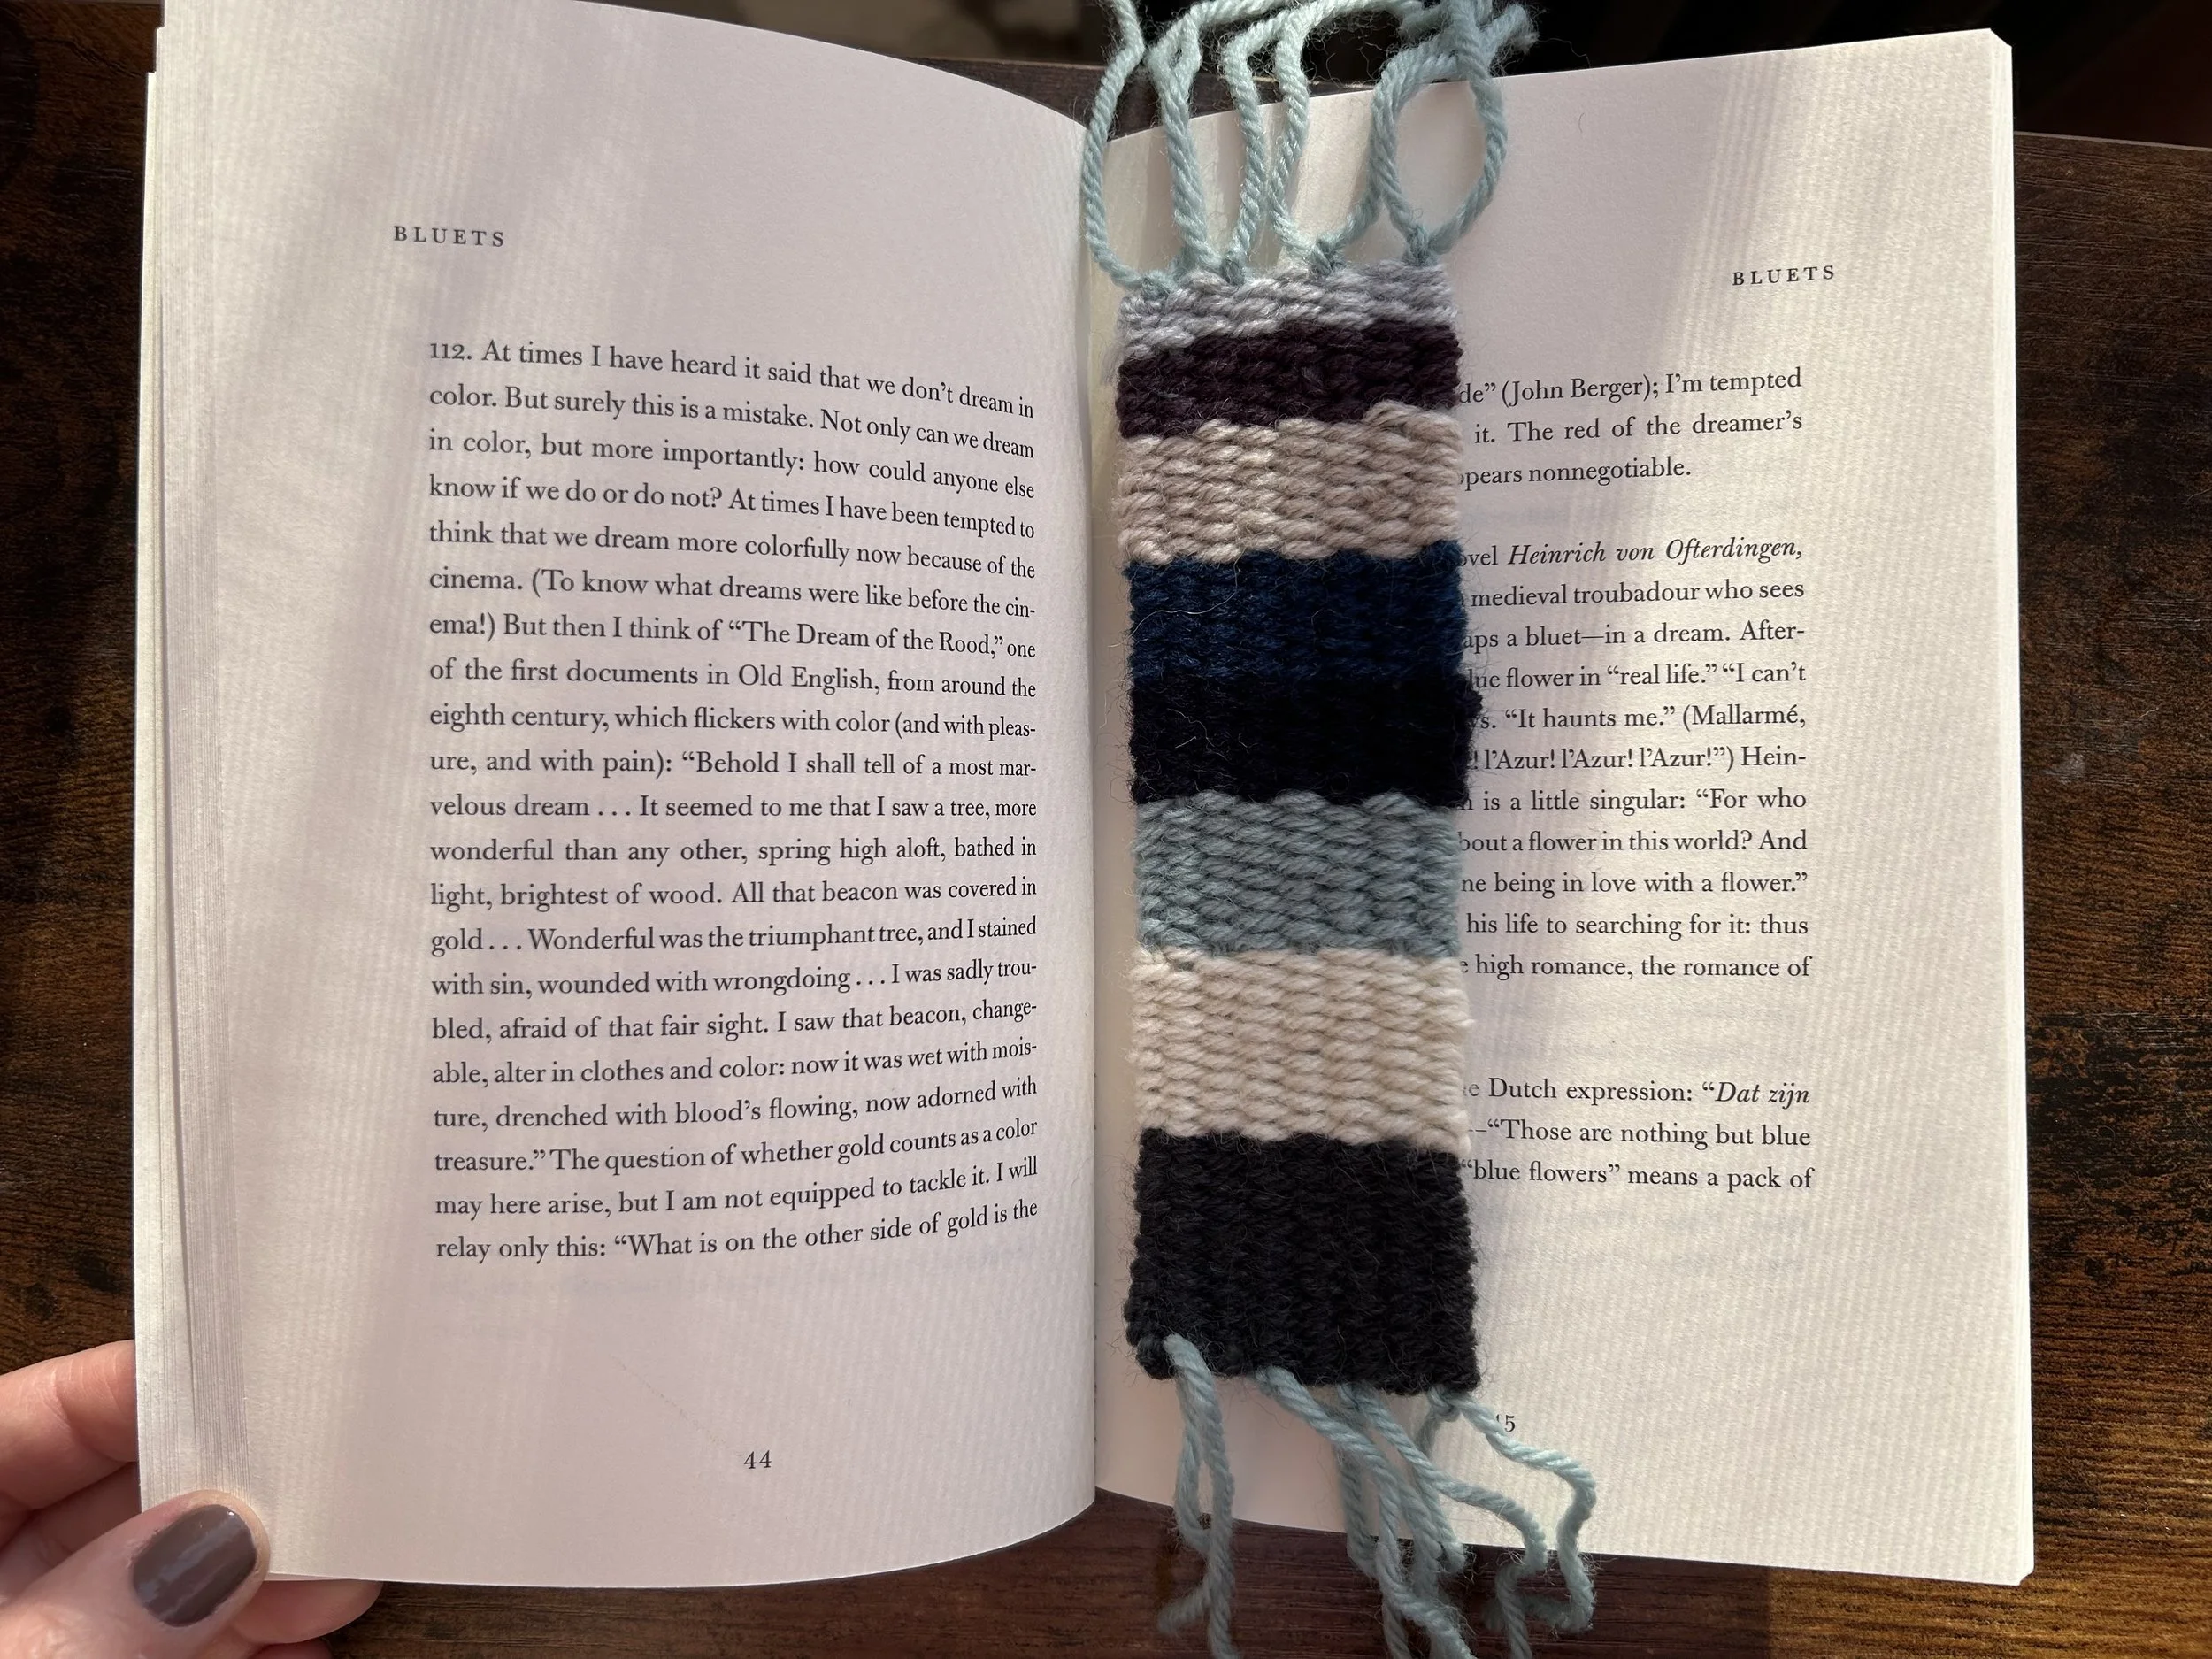
Each emotional bookmark can be customized based on a reader’s own interpretation of the data in their favorite books.


