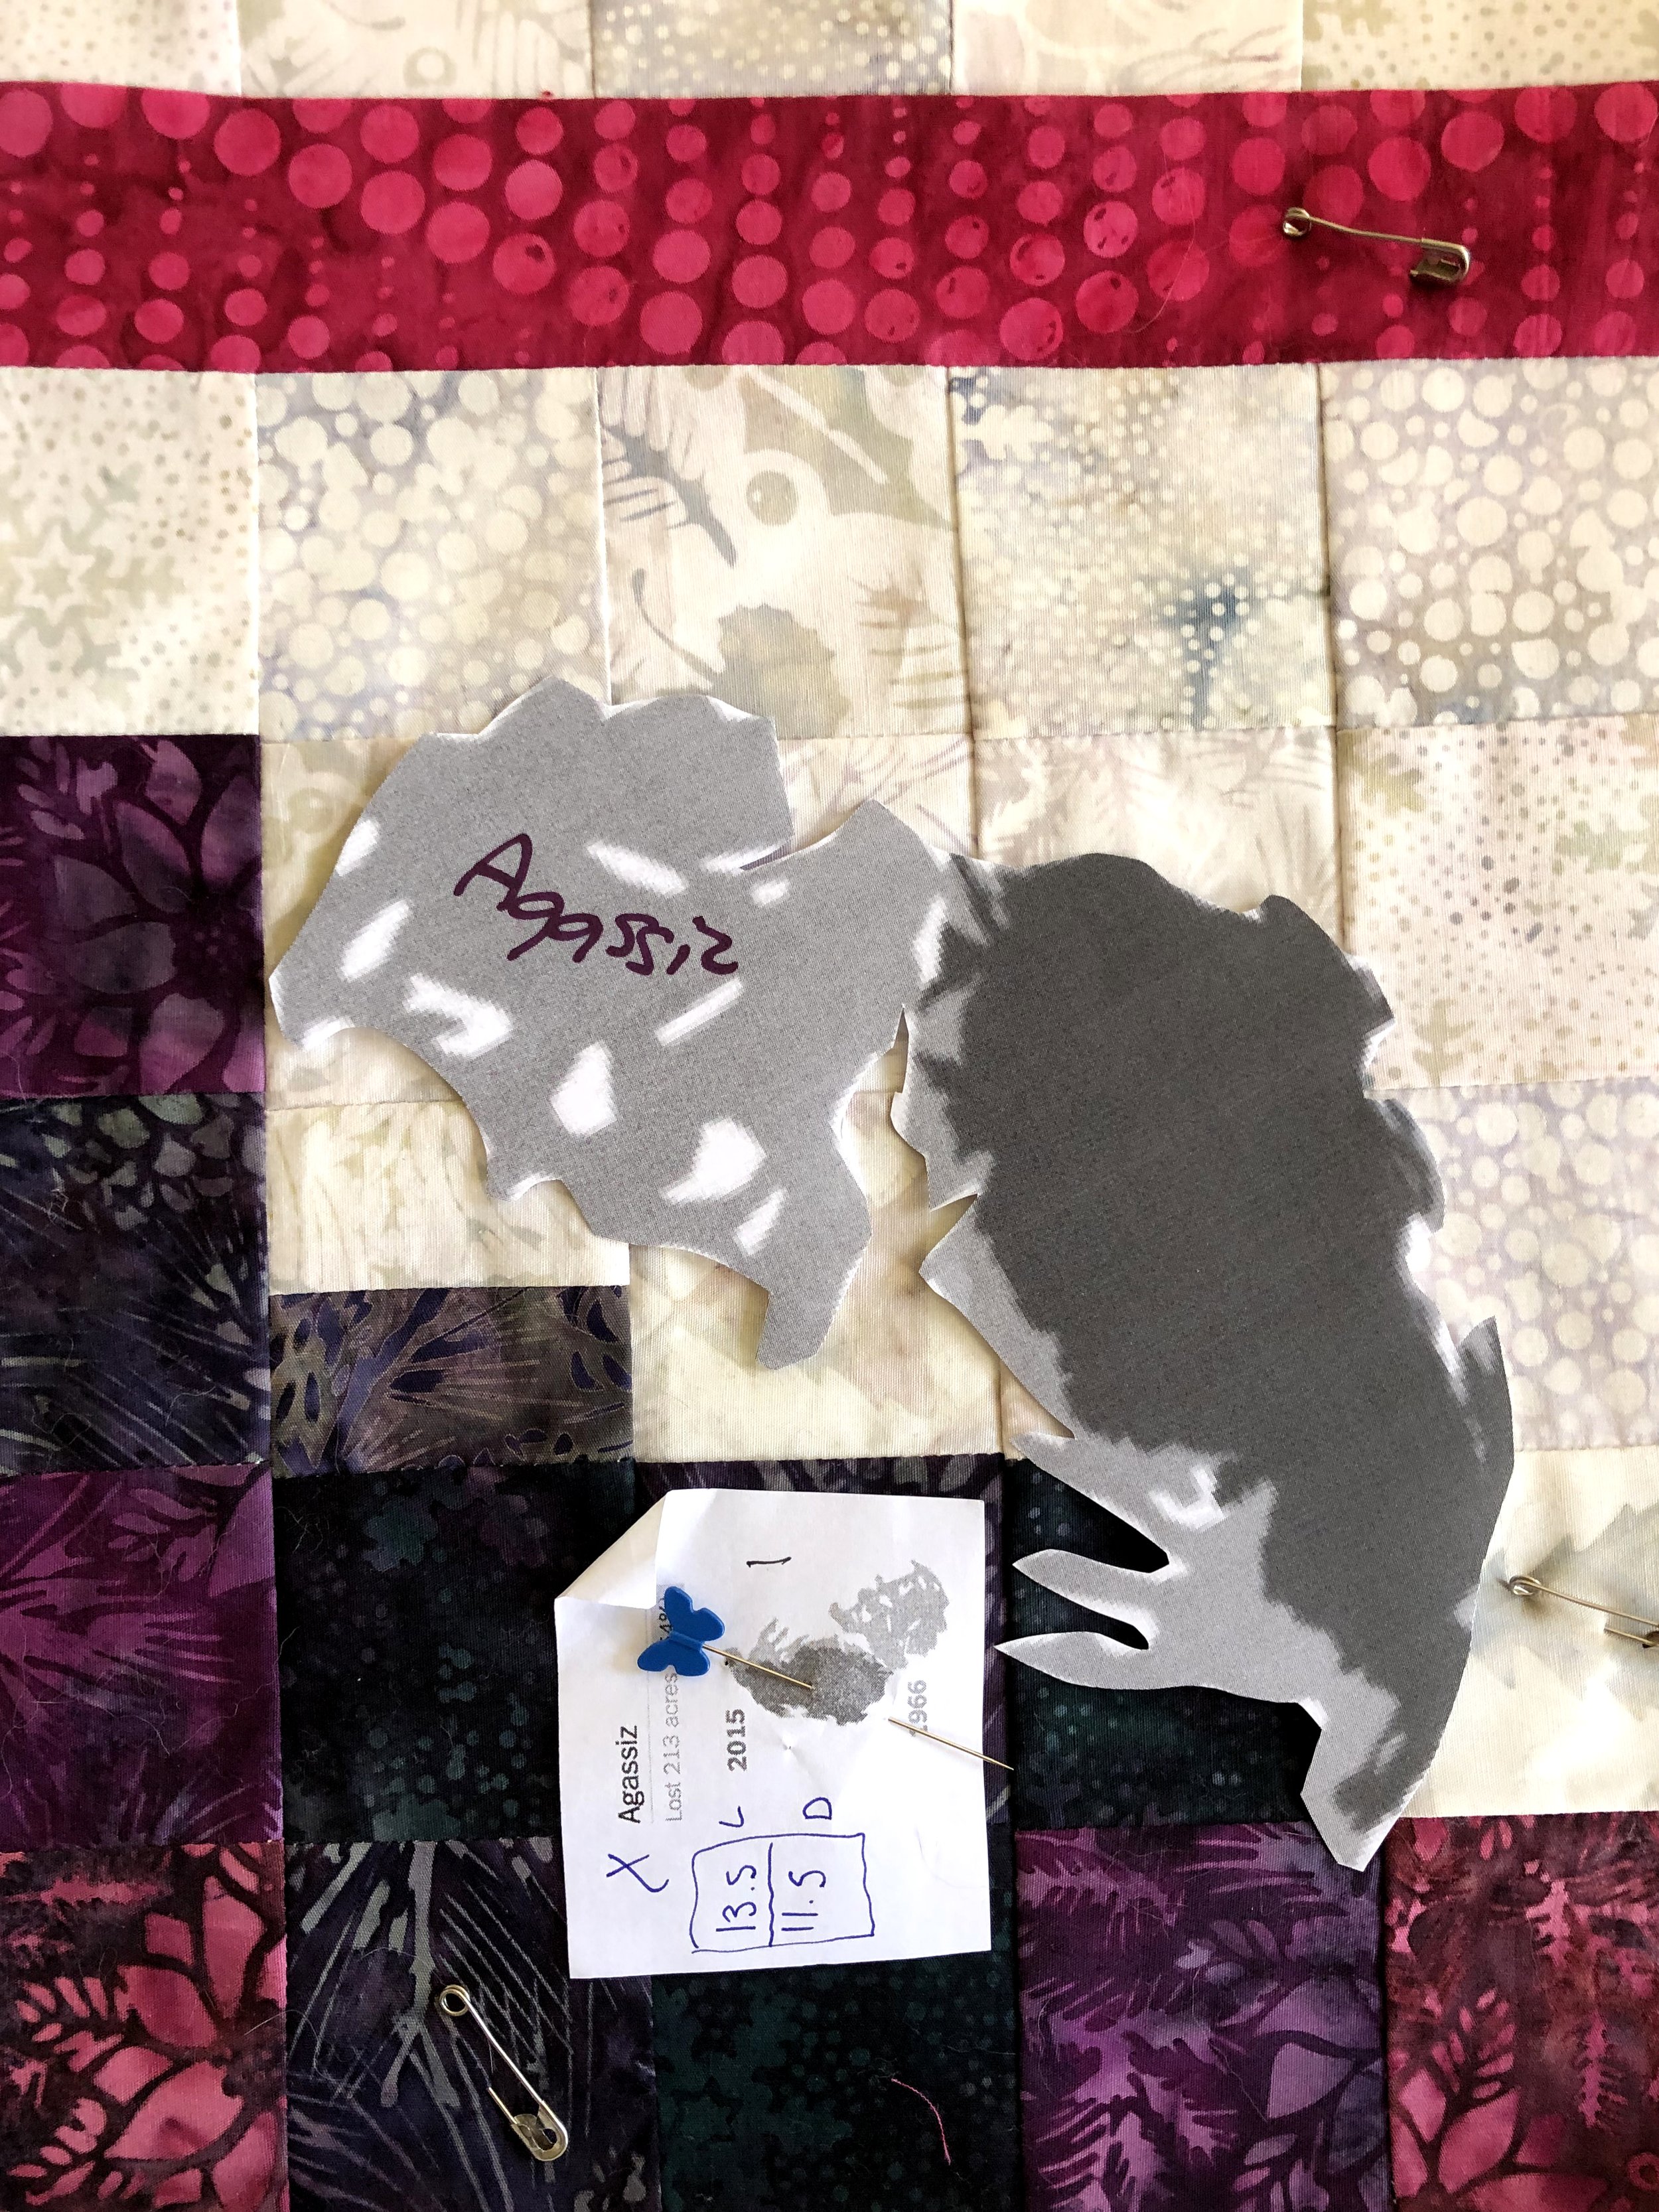
melting glaciers
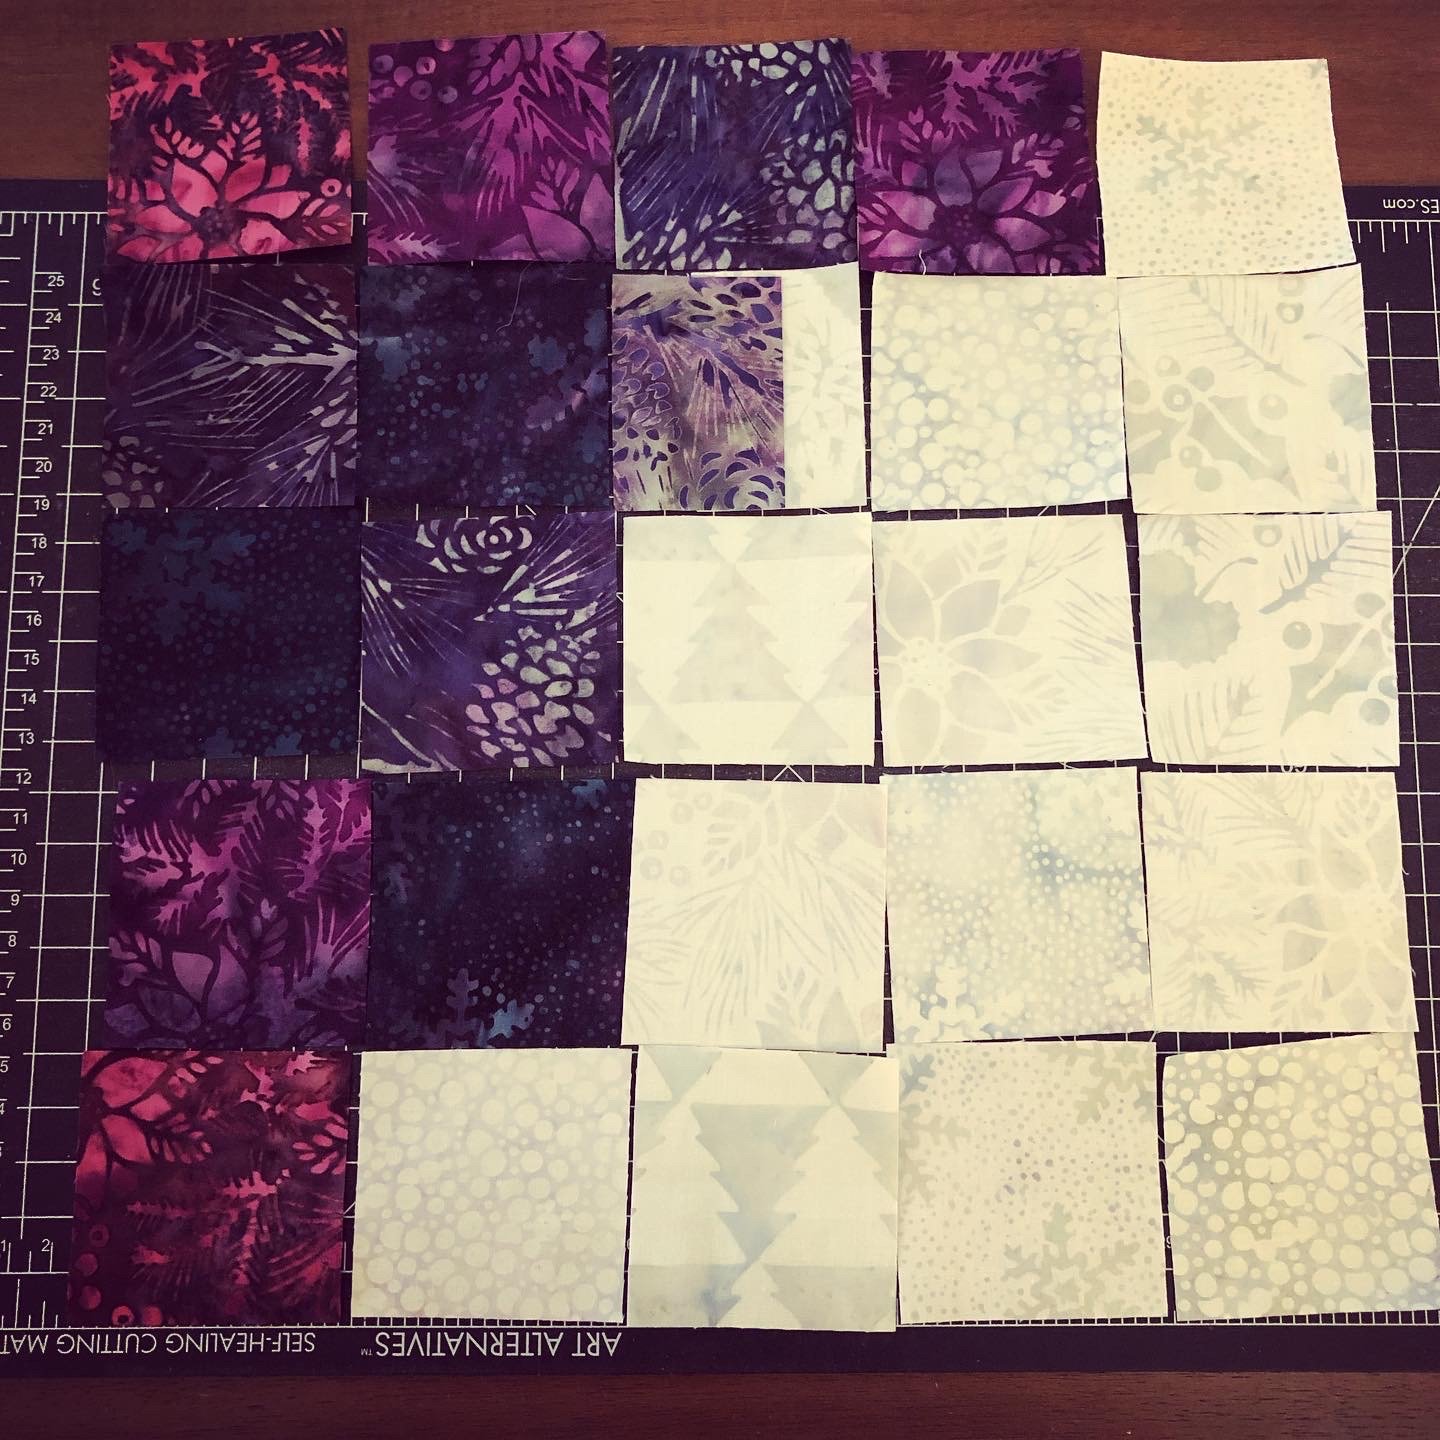
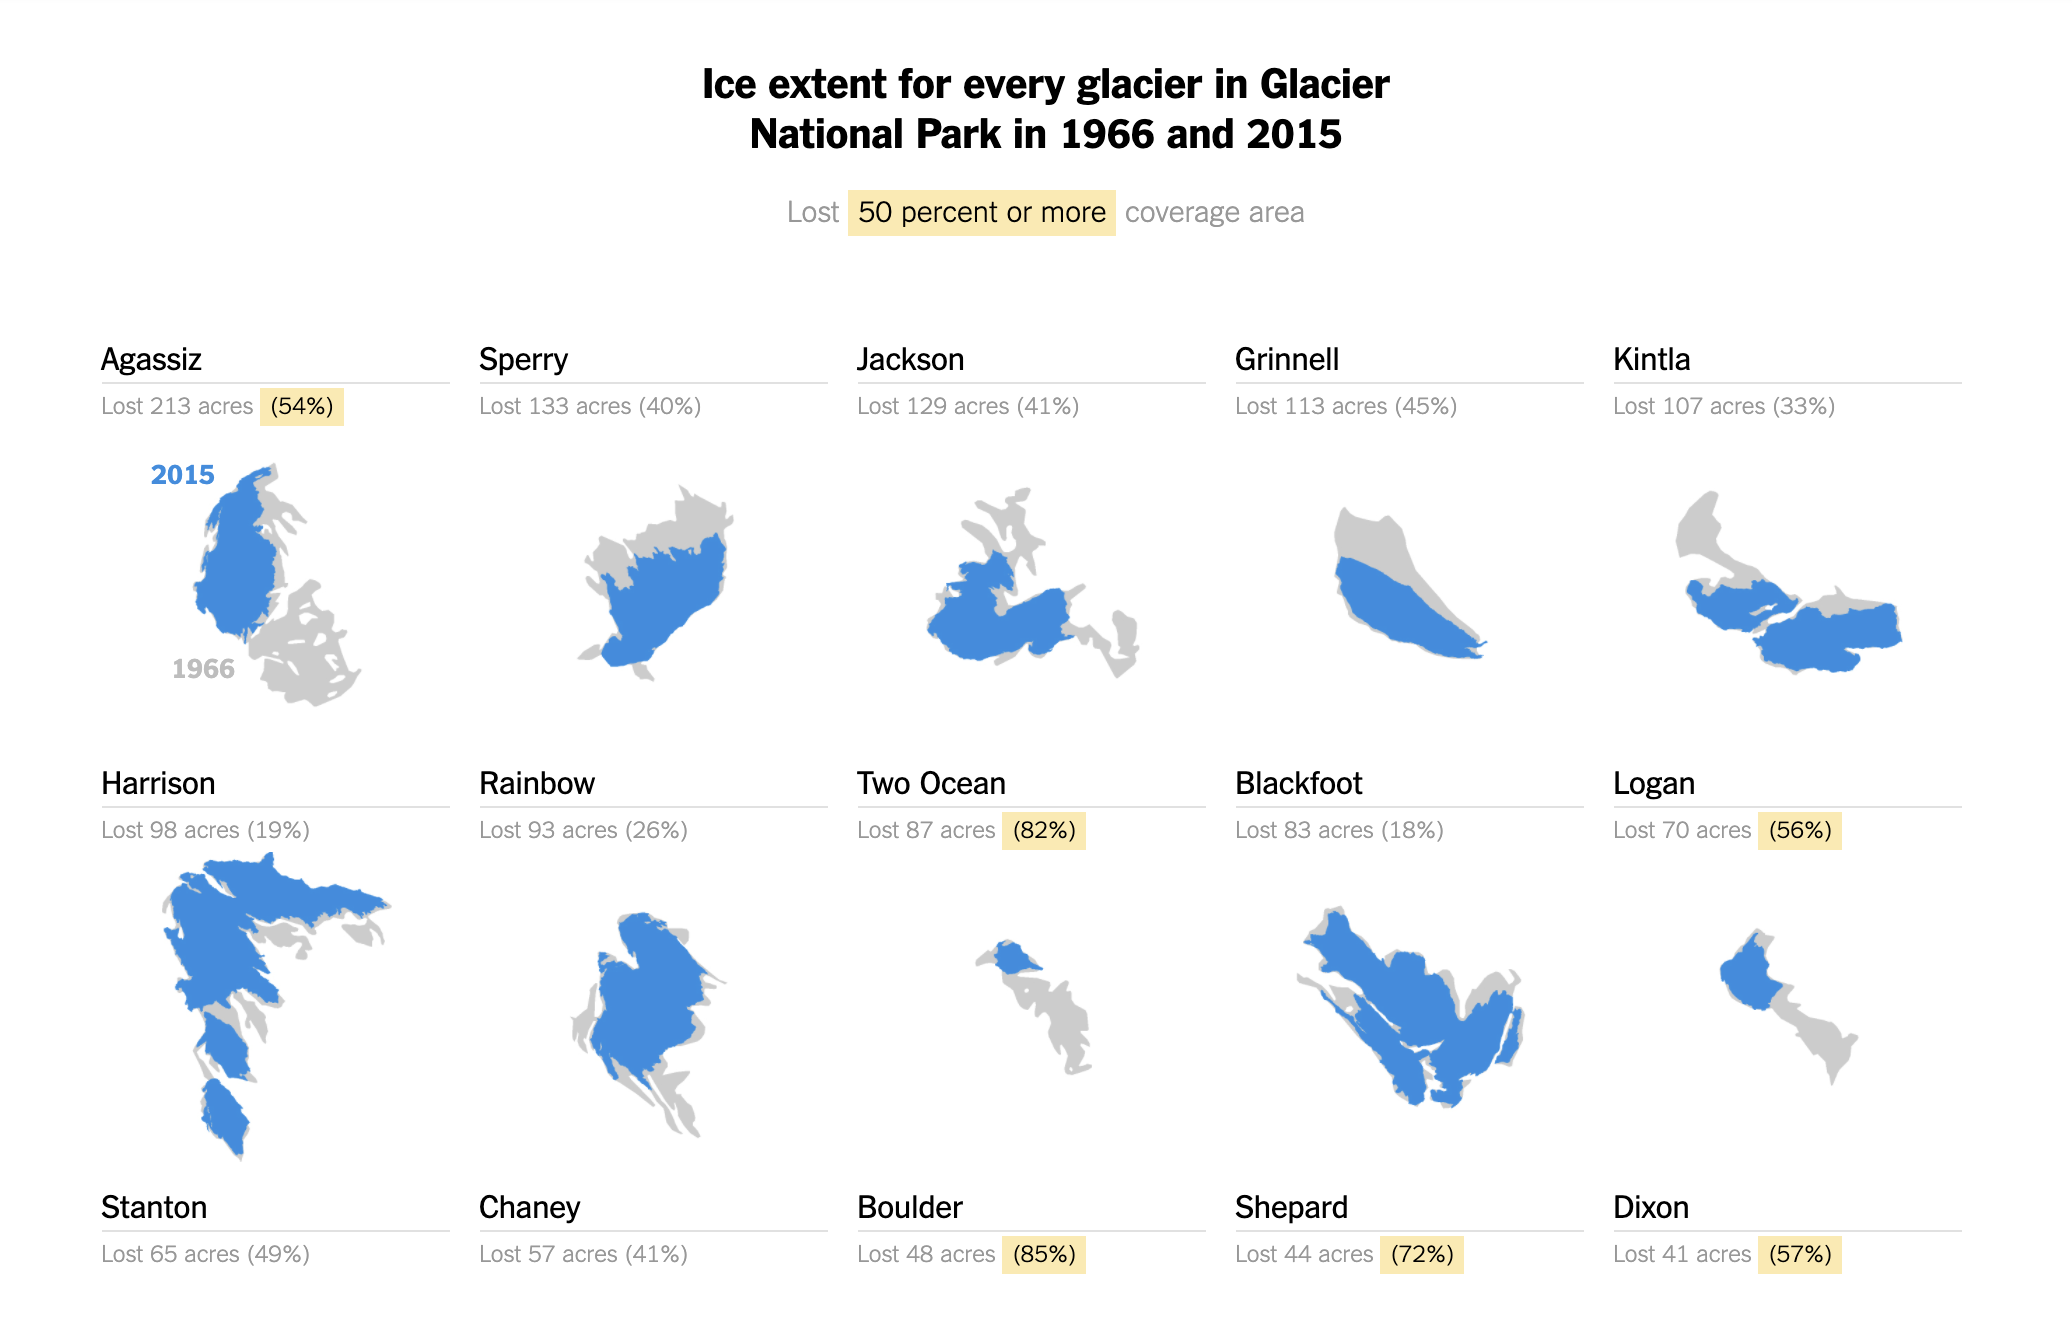
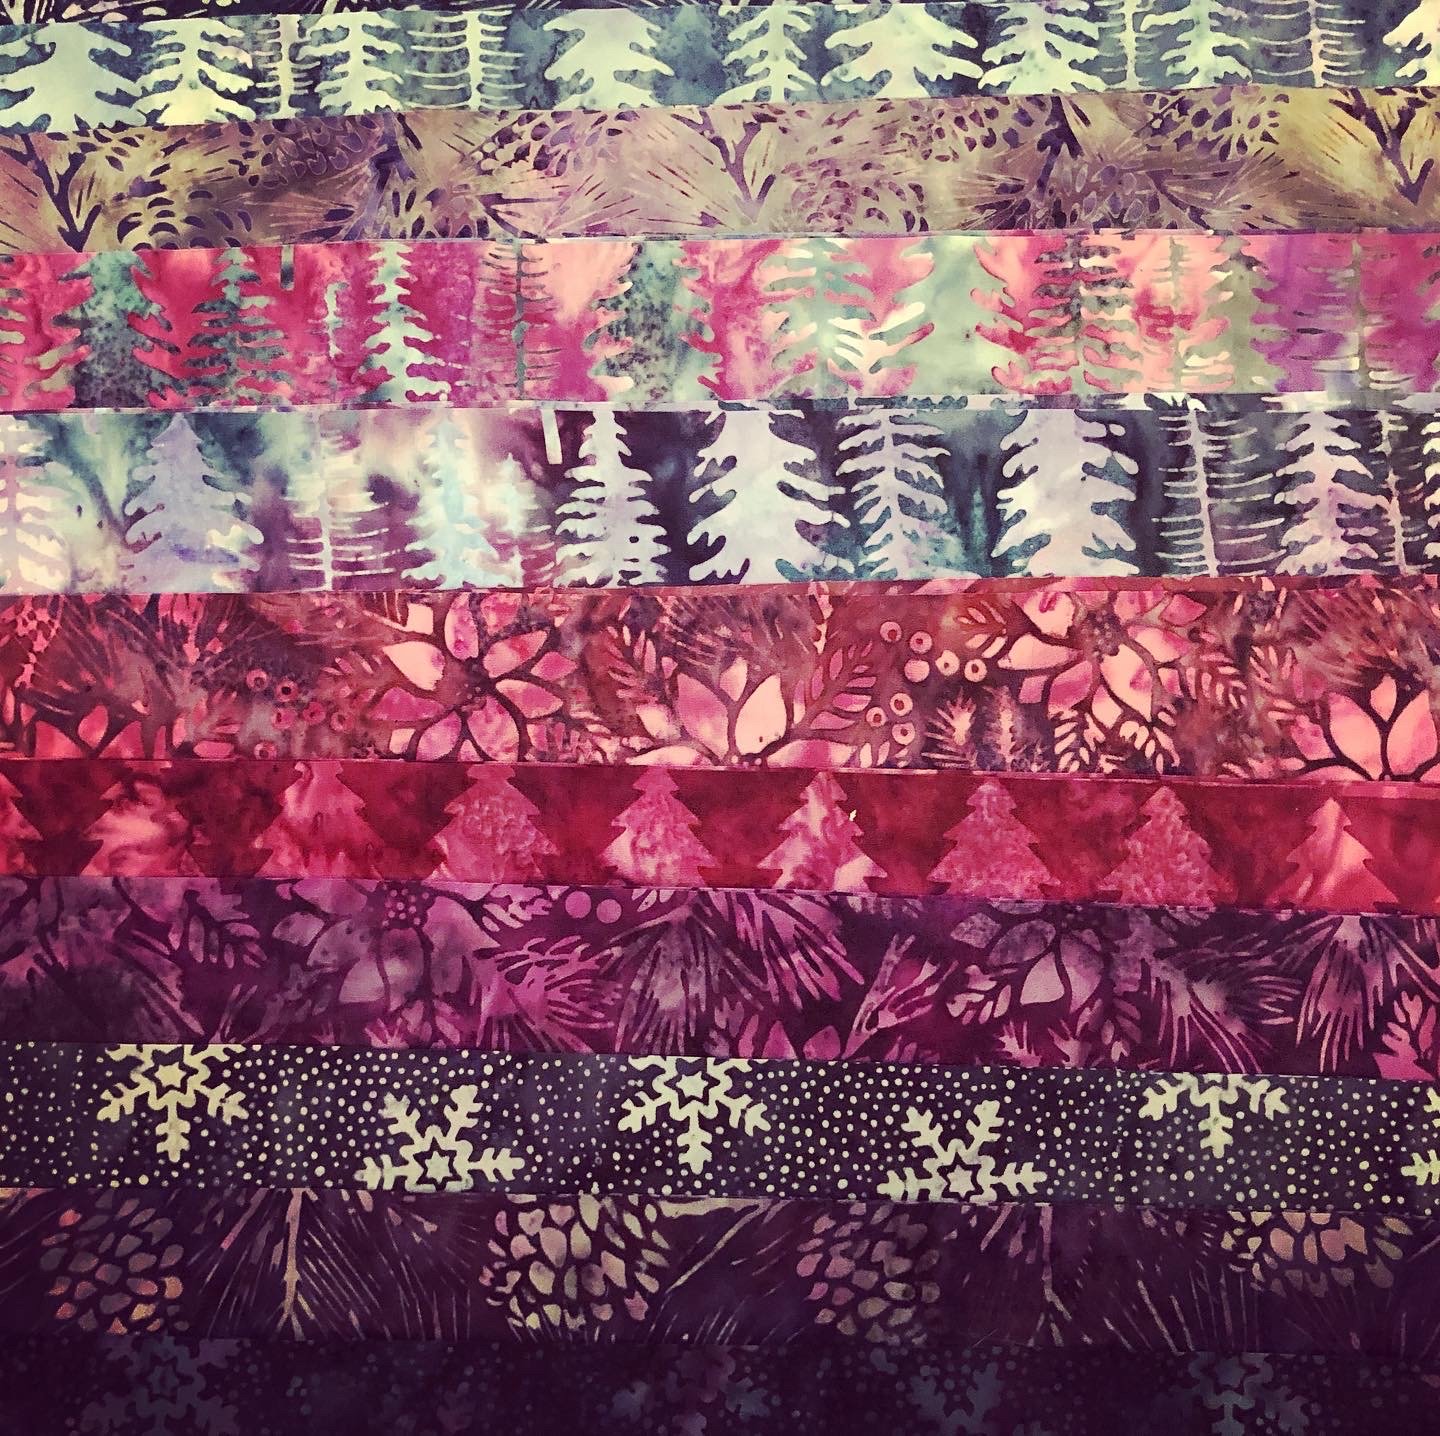
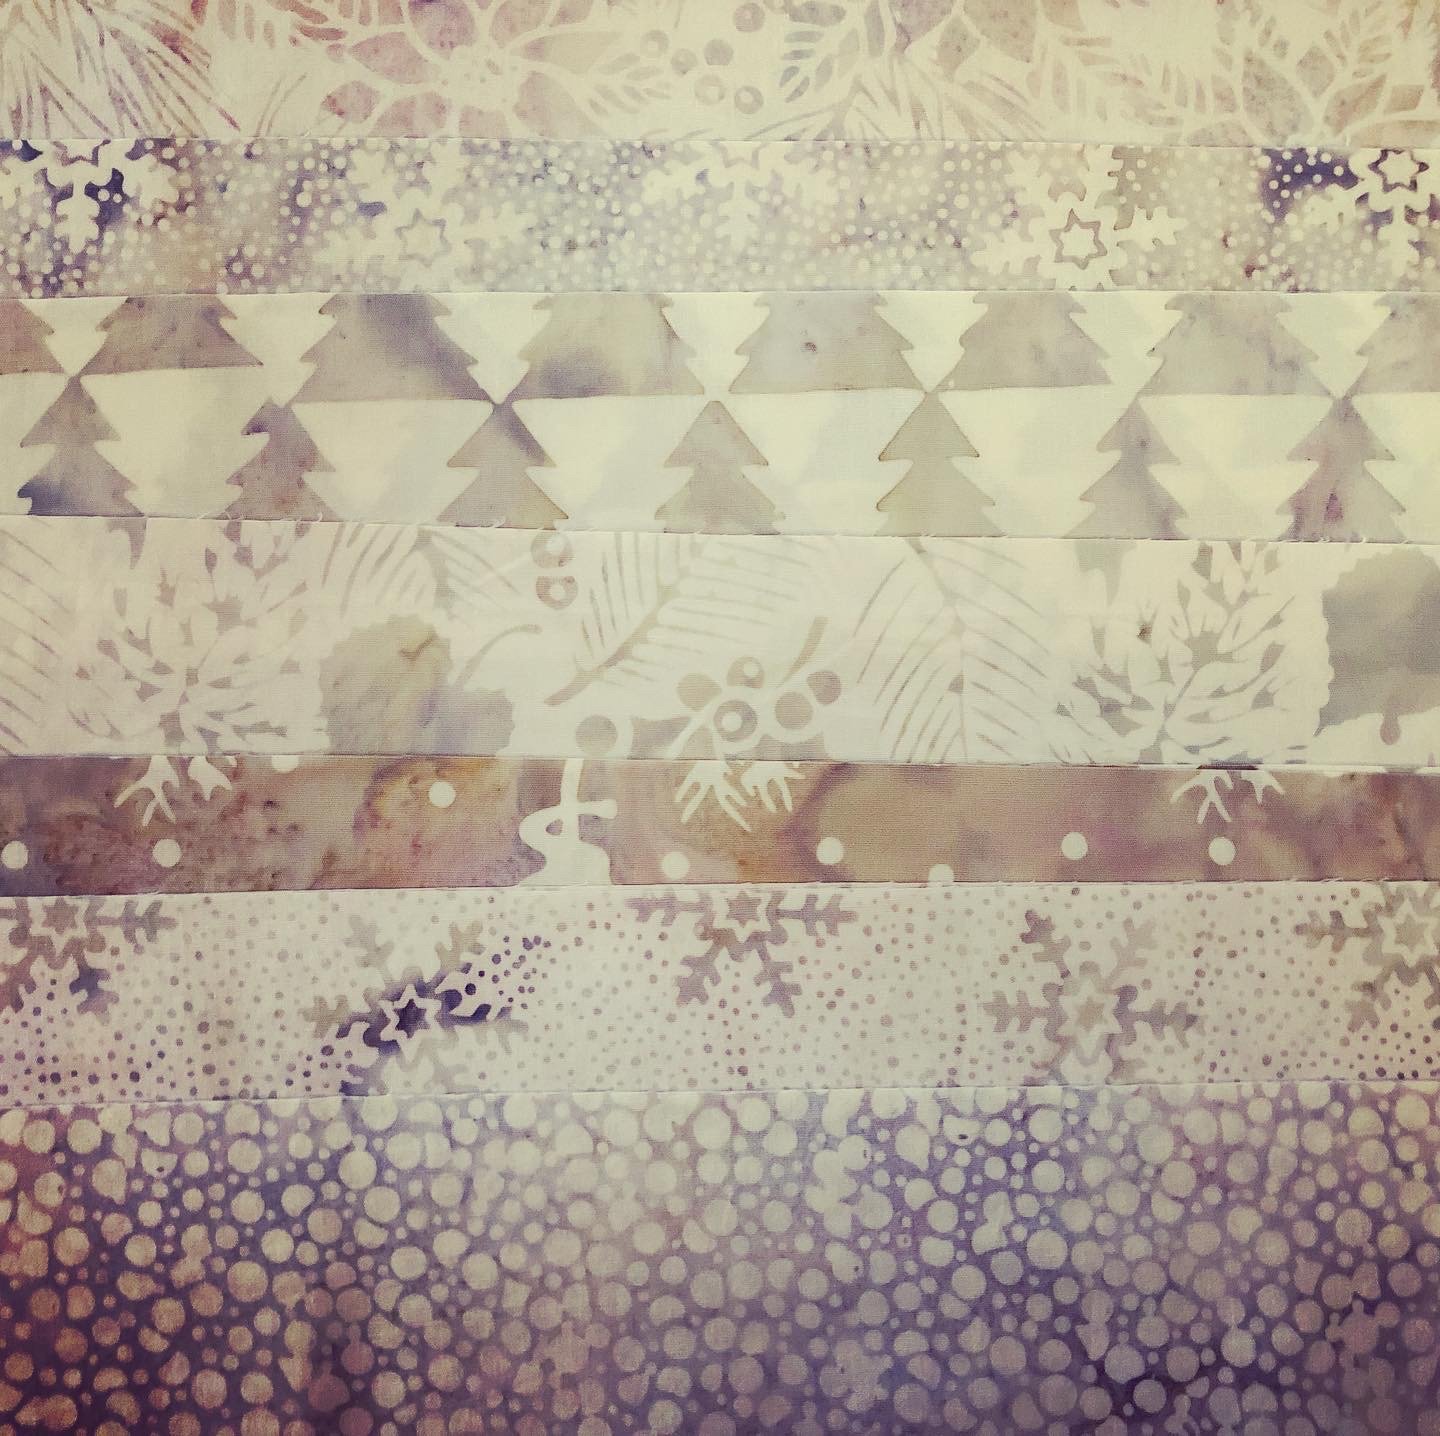
This data quilt is an experiment in data visualization that utilizes quilts to visualize climate data. The project below is based on data about melting glaciers in Glacier National Park. Each block corresponds to a glacier and the design is proportionally representational to how much of the glacier has melted in the past 50 years (e.g. each pattern is based on 25 squares and the dark sqaures represent the amount of glacier that is still left). The quilting on top of the blocks outlines the shape of the glacier and different colored threads are used to represent the disparity of the original glacier and what remains.
